CS Soft Basic - 0554 7040
Data evaluation with CS Basic in 5 languages. Everything at a glance: Tables, graphics and statistics. The user receives all the necessary information at the touch of a button.
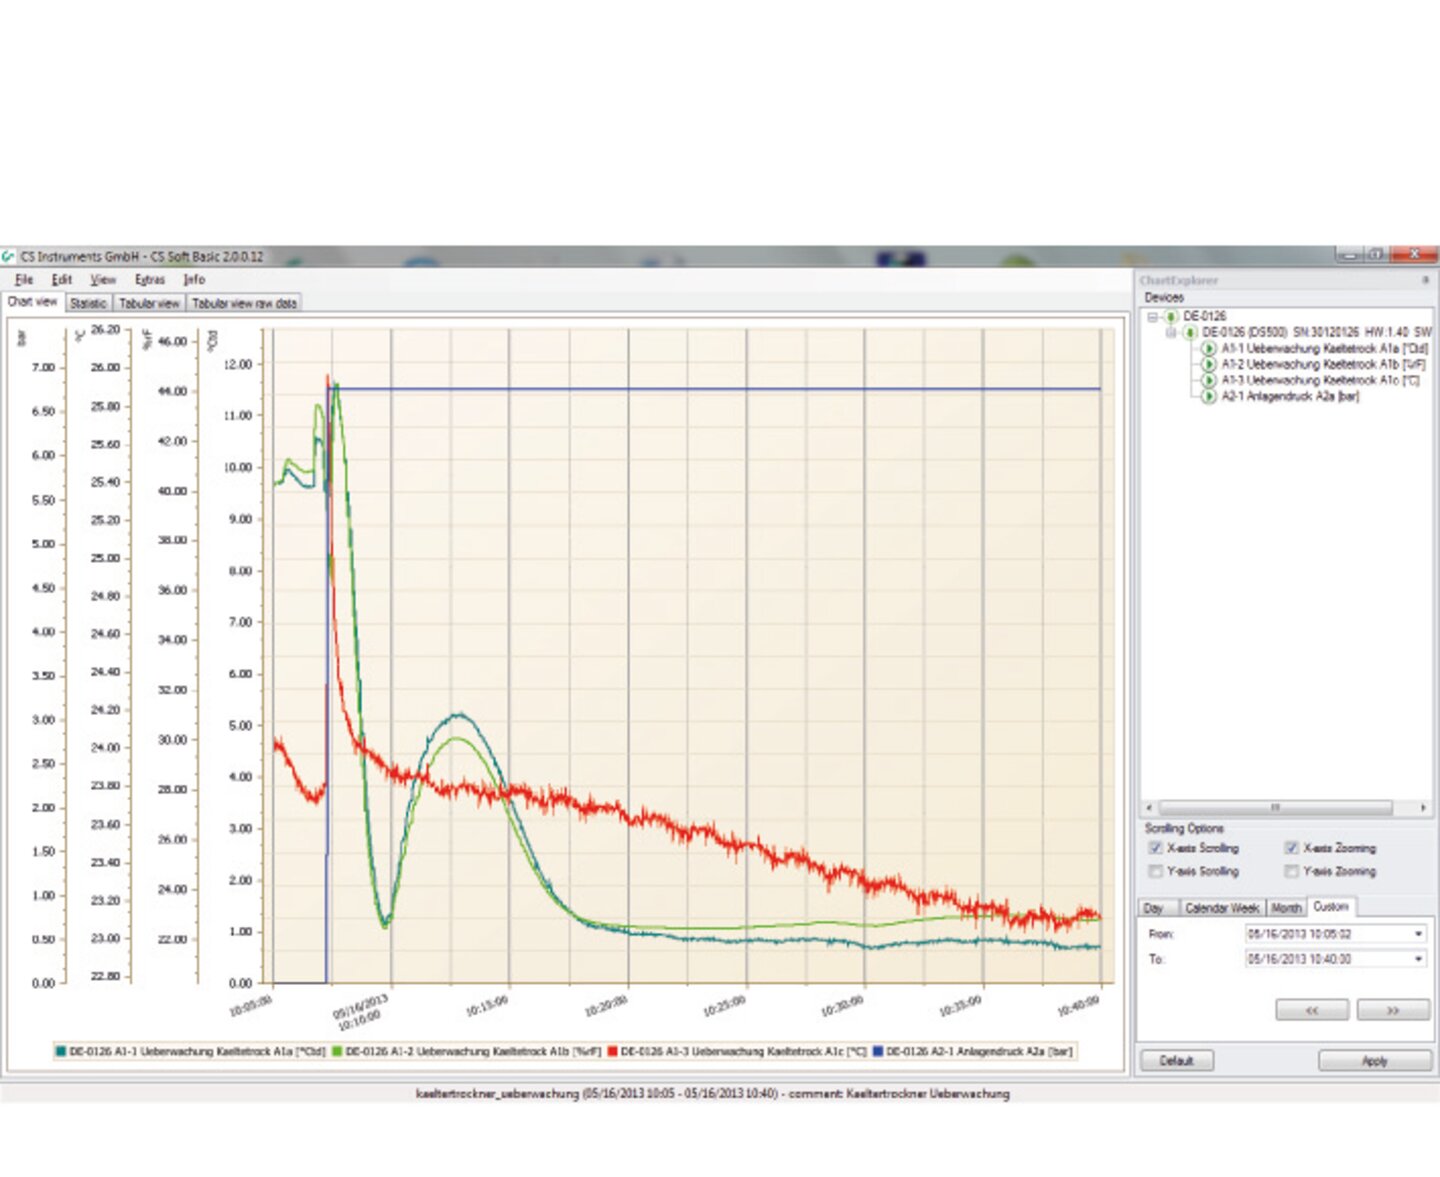
All measurement curves are displayed in colour. All necessary functions are integrated, such as free zooming, selection/deselection of individual measurement curves, free selection of time periods, scaling of axes, colour selection, etc.
This view can be saved as a PDF file and sent by e-mail. Different data can be merged into a single file.
All measuring points with exact time intervals are listed. The desired measurement channels with measurement location names can be selected via the diagram explorer.
All necessary statistical data can be seen at a glance. This allows the user to quickly see which minimum Measured values occurred when and for how long.

