
Ultrasound Camera UltraCam LD 500/510
uses 30 MEMS microphones for the Calculation and visualisation of the ultrasound image. The device also makes inaudible ultrasound audible.
Beamforming refers to the process of focusing a beam. In an ultrasound camera, the analysis is computationally aligned with numerous points in space without the need to move the microphones or camera mechanically. For each pixel, a calculation is performed to determine how a sound signal from that direction in space should arrive at the individual microphones.
This produces an acoustic map: points from the direction of which the microphone signals arrive consistently are assigned a higher level. Points from the direction of which the signals do not match are attenuated. The result is superimposed onto the camera image as a coloured heatmap.
A single microphone can measure sound pressure, but cannot unambiguously determine the direction from which the sound source is coming. A microphone array utilises several highly sensitive digital MEMS microphones positioned at known, geometrically calibrated locations. The compact UltraCam LD 500/510 operates with 30 microphones; the LeakCam 600 utilises 64 digital microphones.
The precisely known geometry of the microphone array forms the basis for the analysis of time-of-flight and phase differences. The spatial arrangement, number and distribution of the microphones have a significant influence on directional resolution and thus on the accuracy of sound source localisation.
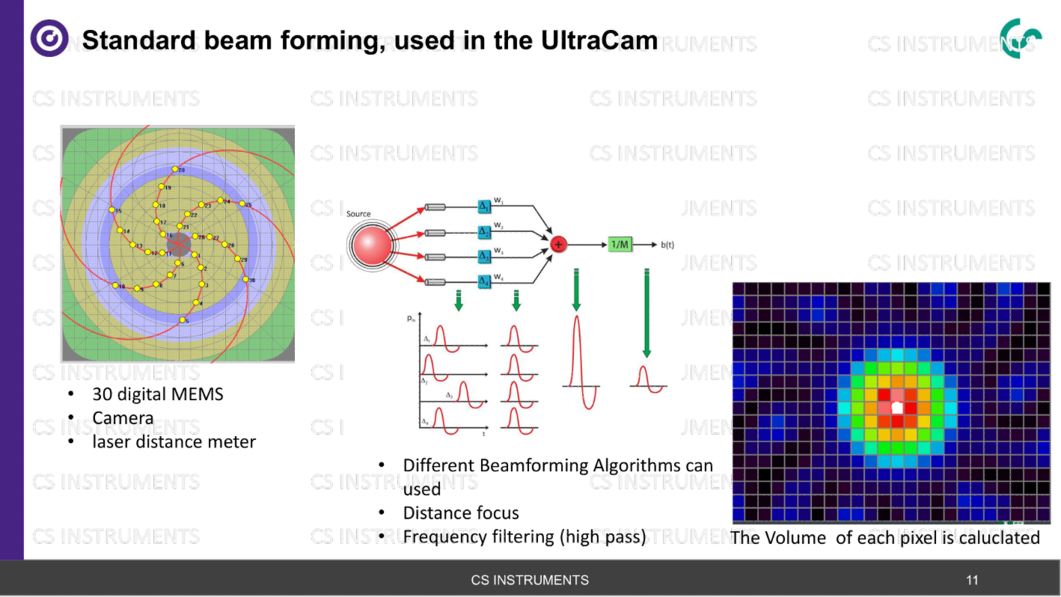
Standard beamforming: microphone array, signal processing, filtering and calculation of the acoustic map.
To perform the calculation, the system requires fixed boundary conditions: focal length or distance to the object, horizontal and vertical angles of aperture, field of view and the desired acoustic resolution. These parameters are used to generate a grid of acoustic pixels.
For each pixel on the ultrasound map, the processor performs a calculation to determine the physical path from each microphone to that point in space. When a sound signal arrives, the microphone signals are corrected for the calculated time-of-flight differences. In the classic delay-and-sum approach, this is carried out in the time domain; in the LeakCam’s power beamforming, phase shifts are used in the frequency domain. At the same time, the signal is digitally filtered to the selected target frequency window.
Following the time or phase correction, the signals from all microphone channels for the pixel in question are summed. If the sound is actually coming from this direction, the signals are in phase with one another and reinforce each other constructively. If the sound comes from a different direction, the signals interfere out of phase and partially cancel each other out destructively.
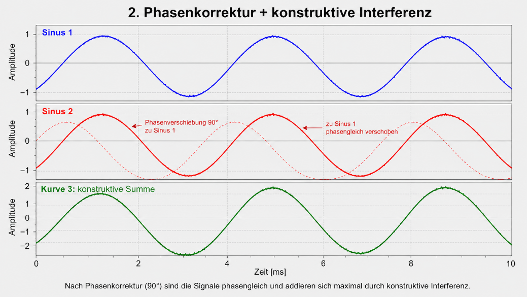 | 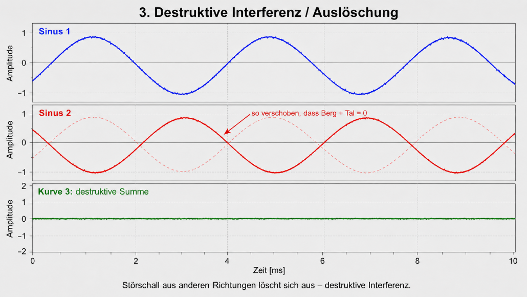 |
| Constructive interference: phase-corrected signals add together and amplify the actual sound source. | Destructive interference: unwanted sound from other directions is attenuated by the summation. |
To provide a smooth, real-time display, the system performs calculations to generate acoustic images in rapid succession. The acoustic data is superimposed as a coloured heatmap directly onto the live optical image. The display guides the user directly to the most likely position of the ultrasound source.
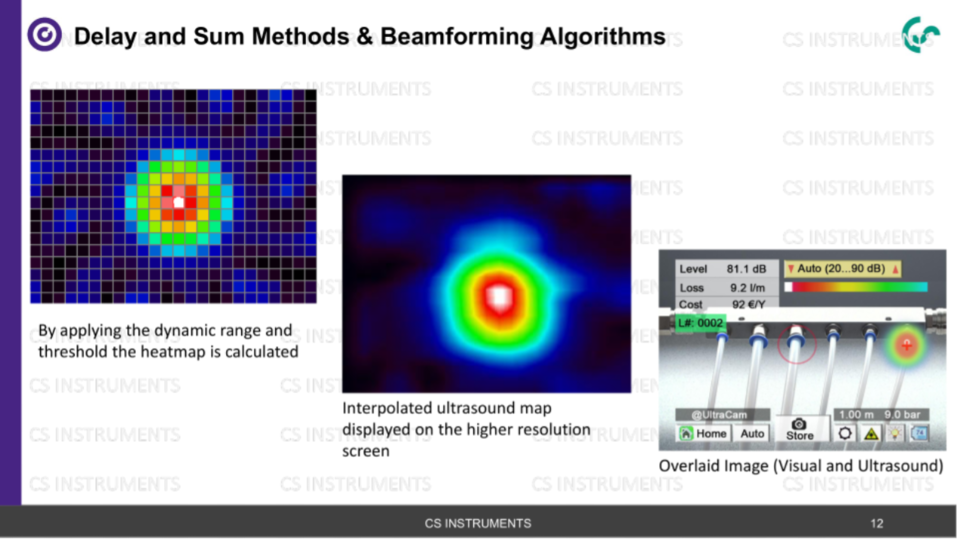
From the calculated ultrasound image to the heatmap: the dynamic range and threshold determine which levels are displayed.
| parameter | Function | Practical effect |
| Threshold | The minimum sound pressure level at which an acoustic event is displayed as a hotspot. | A higher threshold reduces background noise and interference signals, but may mask weak leaks. |
| Dynamic range | The range of levels that can be displayed between the quietest and loudest signals in the same image. | A high dynamic range makes it easier to visualise sound sources of varying loudness simultaneously. A low dynamic range can emphasise weak signals close to the noise level more strongly. |
| Frequency window | Selected frequency range that is analysed and visualised. | Selecting a suitable frequency window improves the separation of leakage signals and sources of interference. |
| Focus distance | The distance from the sound source to which the acoustic calculation is calibrated. | A correctly set focus distance improves sound source localisation and the accuracy of the leakage estimate. |
The display produced by an ultrasound camera can be compared to that of a thermal imaging camera. An infrared camera measures thermal radiation and assigns temperature values to individual pixels. An ultrasound camera measures frequency-dependent sound pressure levels and assigns these acoustic values to spatial directions or pixels.
In both cases, the user sees a visual image with superimposed colour information. With a thermal imaging camera, the colour indicates temperature differences. With an ultrasound camera, the colour indicates the intensity of the calculated sound source. The heatmap is therefore not a photograph of the leak, but an acoustic localisation superimposed on the video image.
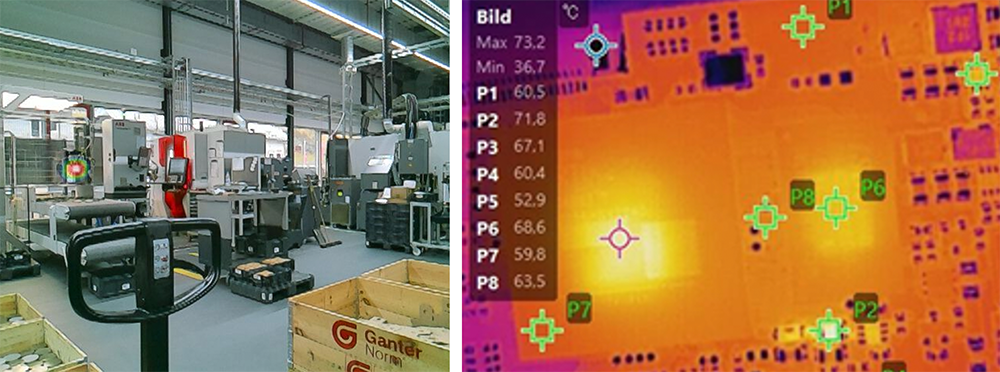 |
| Analogy: visual image of the plant and thermal or acoustic colour image. With ultrasound, the colour represents sound pressure, not temperature differences. |
Standard beamforming is effective at localising individual dominant sound sources. In practice, however, multiple leaks or sources of interference with different sound pressure levels often occur simultaneously. The dynamic range of a system determines the maximum level difference that can be displayed between the strongest and weakest visible sound sources.
A high dynamic range improves the simultaneous detection of leaks of varying loudness. A low display dynamic range may highlight weak sources more clearly, but reduces the level range visible in the image.
The LeakCam 600’s Power Beamformer is designed for high spatial resolution and the simultaneous visualisation of multiple sound sources. This ensures that even weaker leaks remain visible alongside dominant sound sources and can be localised more easily.
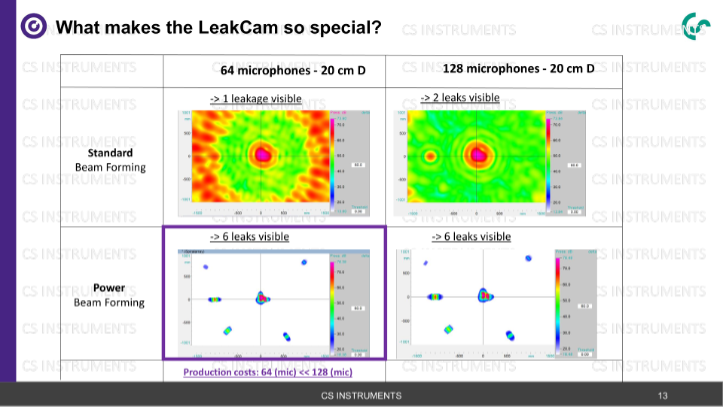
Comparison from the webinar: Power beamforming visualises multiple leaks more clearly than standard beamforming.
uses 30 MEMS microphones for the Calculation and visualisation of the ultrasound image. The device also makes inaudible ultrasound audible.

Detects multiple leakages simultaneously with globally unique Power Beam Forming. 4th generation technology - also suitable for other gases. Helps to locate and repair leaks - including cost estimation and ISO 50001 documentation.