CS Basic - 0554 8040
All important functions can be accessed via the dashboard.
- Global Settings: Set units and change decimal places. Store company name and logo
- Read in real-time data: Establish an Ethernet connection to the CS logger or sensor. Track Measured values in real time graphically or in tabular form
- Import from CS Basic: Data transfer from the previous version CS Soft Basic
- Backup: Backup the project and database
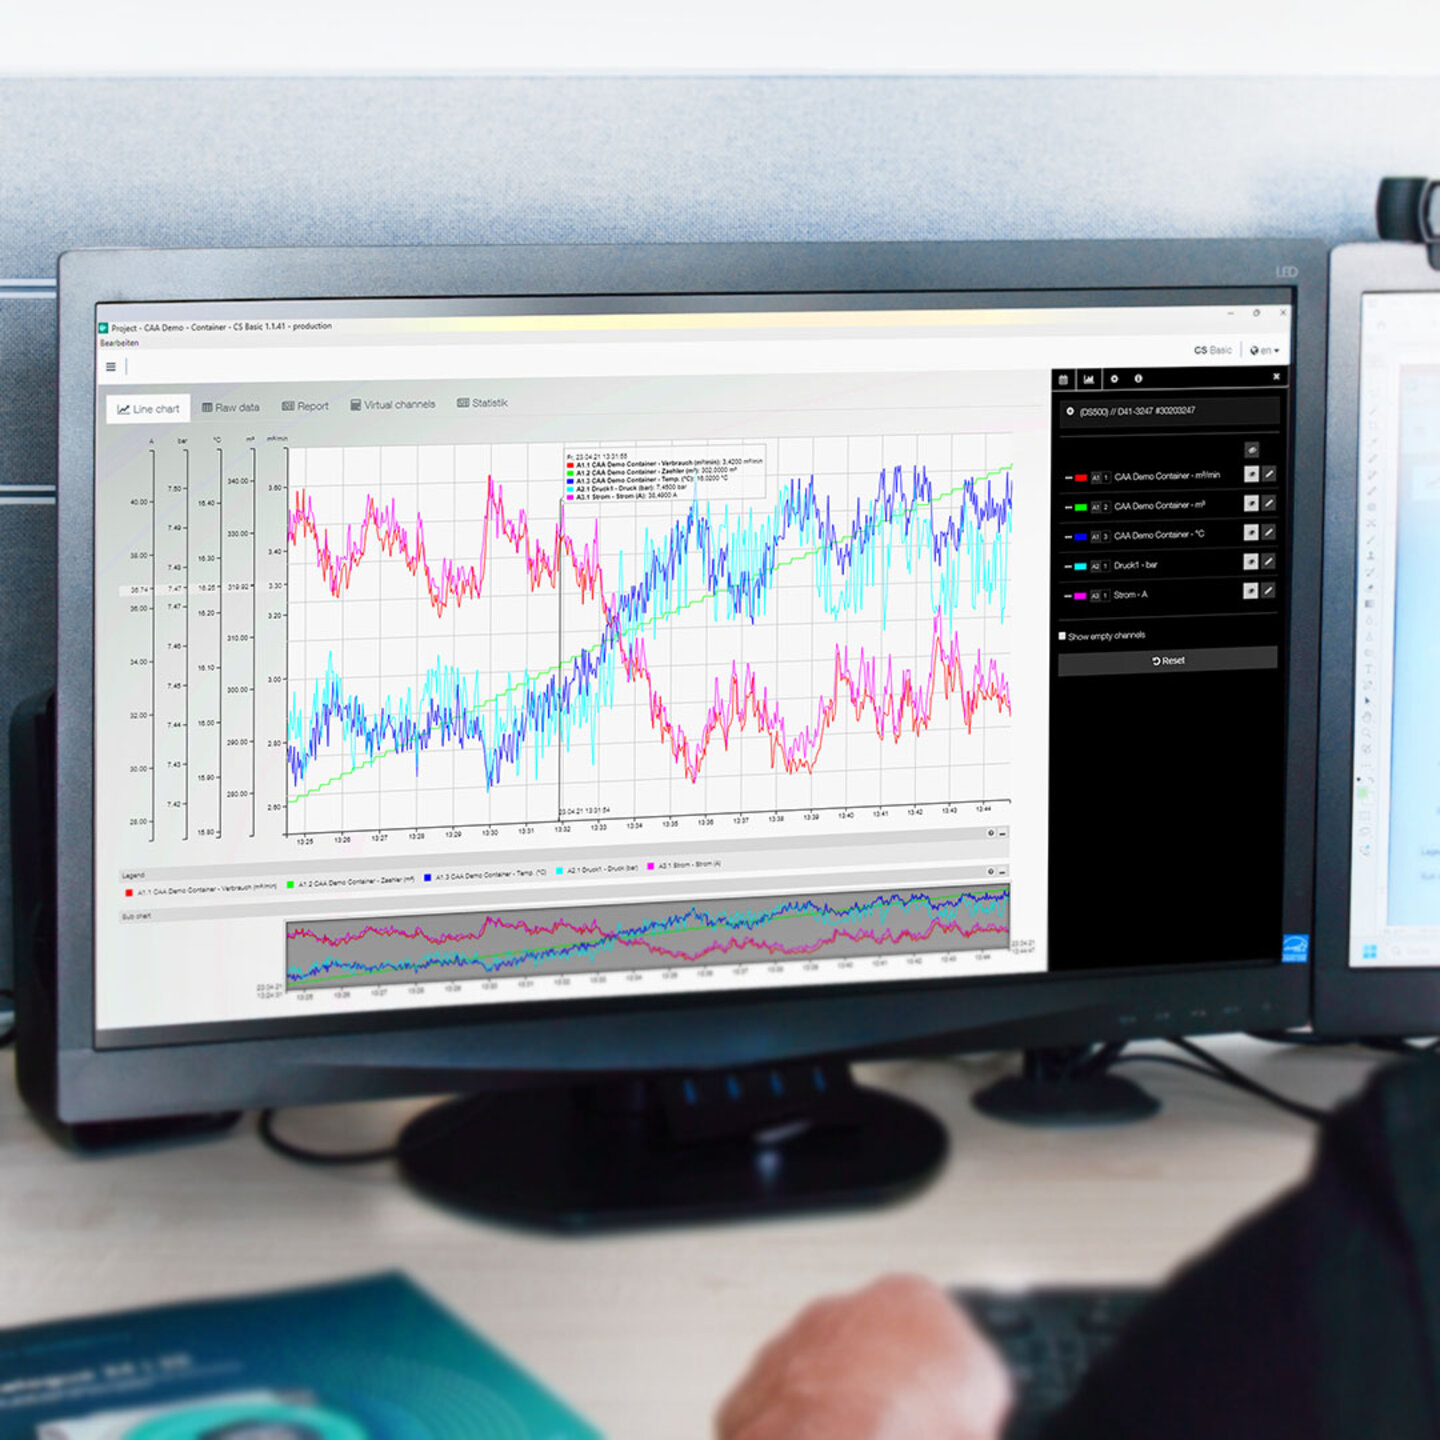
All measurement curves are displayed in colour. All necessary functions are integrated, such as free zooming, selection/deselection of individual measurement curves, free selection of time periods, scaling of axes, colour selection etc.: This view can be saved as a PDF file and sent by e-mail. Different data can be merged into a single file.
All measuring points with exact time intervals are listed. The desired measurement channels with measurement location names can be selected via the diagram explorer.
All the necessary statistical data can be seen at a glance. This allows the user to quickly see which minimum or maximum Measured values occurred when and for how long.
The Software creates a consumption evaluation for all connected Consumption sensors, optionally as a daily, weekly or monthly evaluation.
DOWNLOAD - CS Basic

