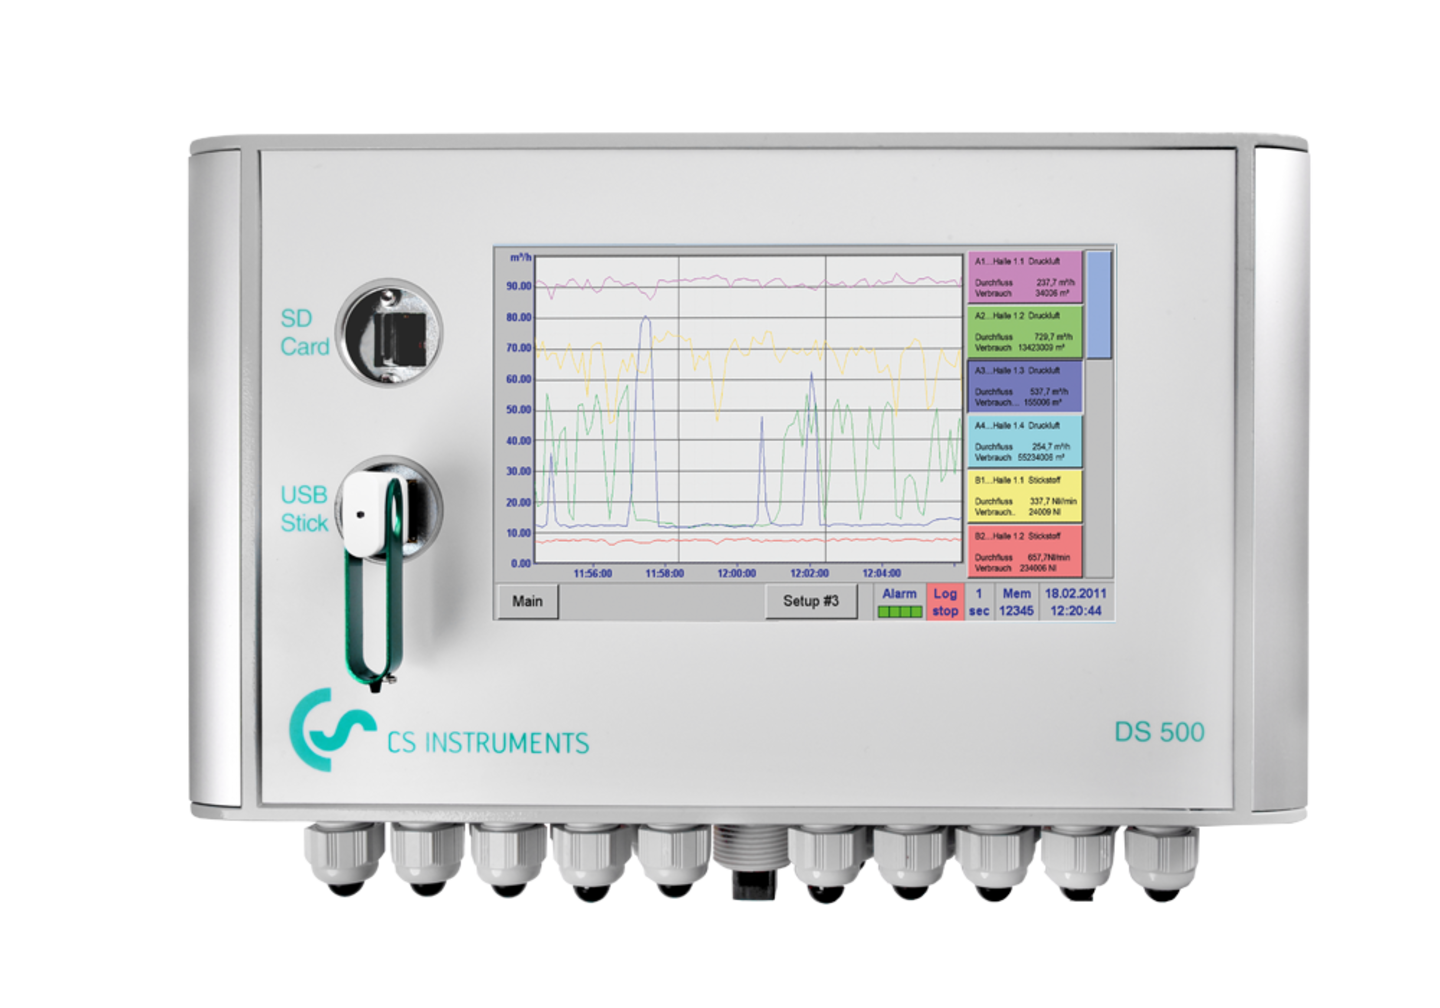
DS 500 – Energy analysis for gas and compressed air systems

Data logging, display on the large colour screen, alarm notification, data storage and even remote read-out via a web server… all this is possible with the DS 500. Alarms can be sent via text message or email when used in conjunction with CS Soft Basic. All measured values, measurement curves and threshold value exceedances are displayed. With a simple swipe of the finger, the curve history can be viewed from the start of the measurement. Daily, weekly and monthly reports showing costs in € and meter readings in m³ for each consumption sensor round off this well-designed system concept. The key difference compared to standard paperless chart recorders on the market lies in the simplicity of commissioning and measurement data analysis. All sensors are automatically recognised by the DS 500 and supplied with voltage. Everything is perfectly coordinated.

to the request

The product has been added to the request.
to the request

Details

  • Clear and easy to read: 7" colour display with touch screen
  • Versatile: Up to 12 sensors of your choice can be connected
  • Suitable for industrial use: Metal housing (IP 65) or control cabinet mounting
  • Available worldwide: Network-compatible with remote data transmission via web server
  • Intelligent: Daily/weekly/monthly reports
  • Maths function for internal calculations
  • Totalizer function for analogue signals
  • Saves time and costs during installation

e.g. The typical key performance indicators for a compressed air system

  • Costs in € per m³ of air produced
  • kWh/m³ of air produced
  • Consumption of individual lines, including totalisation

e.g. 0/4...20 mA, 0…10 V. In the case of third-party sensors which, for example, only supply a 4…20 mA signal for the instantaneous volume flow in m³/h, a total meter reading in m³ can be generated using the totalizer function.